Below is a set of supplementary figures for Hoag et al. (2016), in which a subset of these figures appears. The figures here show all of the multiple images in the cluster MACS0416 confirmed with the GLASS spectroscopy, including the multiple images with previous spectroscopic redshifts from other authors (see Hoag et al. (2016) for full details). The uncertainty on the redshift is 0.01 unless otherwise stated.

Figure 1: Grism spectroscopic confirmation at z=1.90 for ID #268 (arc 2.1) observed at the two P.A.s shown in the two sub-figures. In each sub-figure, the two panels on top show the 1-dimensional spectra, where the observed flux and contamination model are denoted by blue solid and red dashed lines respectively. The cyan shaded region represents the noise level. The six panels at the bottom show the 2-dimensional postage stamp created from the coadded HFF+CLASH+GLASS image, the 1-dimensional collapsed image, and the interlaced 2-dimensional spectra without (top) and with (bottom) the contamination subtracted. In the 1- and 2-dimensional spectra, the identified emission lines are denoted by vertical dashed lines in magenta and arrows in red respectively.

Figure 2: Same as Figure 1, except that object ID #248 (arc 2.2) is shown. The same emission lines observed in the spectra of arc 2.1 are observed at approximately the same wavelengths in both P.A.s of arc 2.2, showing that the two are multiple images of the same galaxy. The grism redshift is in agreement with a previous spectroscopic redshift of system 2 obtained by Jauzac et al. (2014) from optical spectroscopy.

Figure 3: Same as Figure 1, except that object ID #572 (arc 2.3) is shown. The same emission lines observed in the spectra of arc 2.1 and 2.2 are observed at approximately the same wavelengths in both P.A.s of arc 2.3, showing that all three are multiple images of the same galaxy.
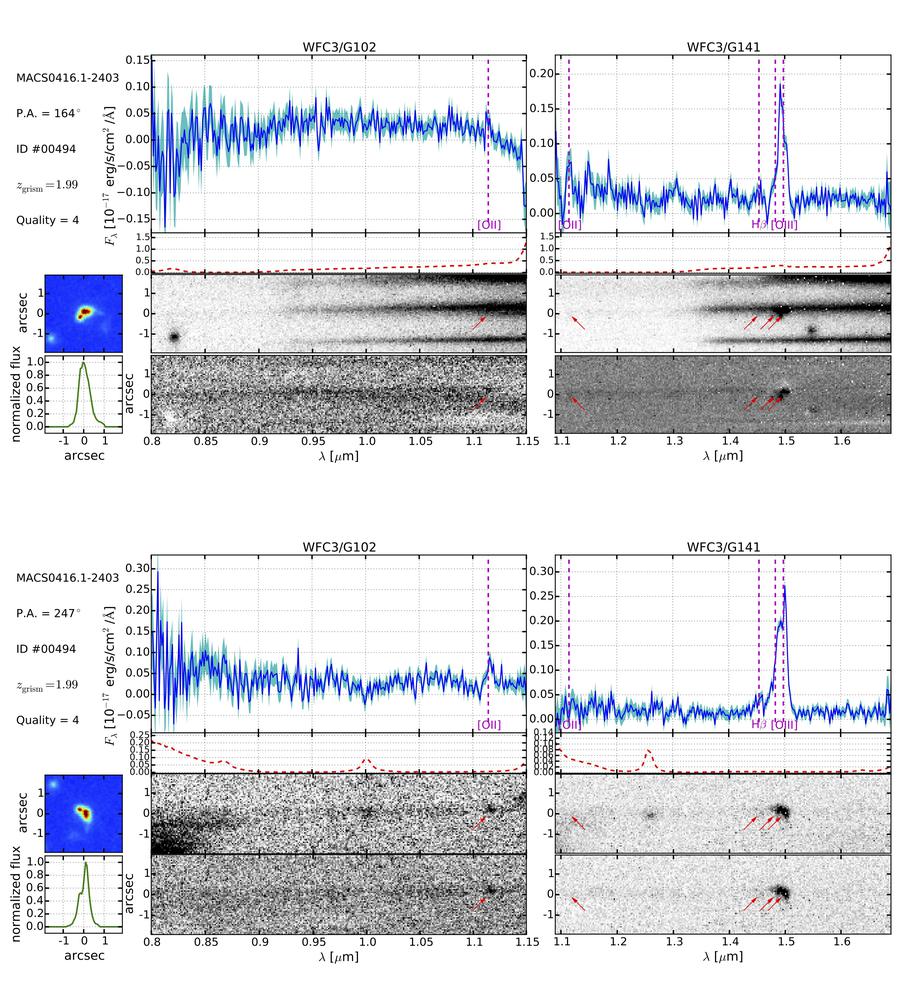
Figure 4: Same as Figure 1, except that object ID #494 (arc 3.1/4.1) is shown.

Figure 5: Same as Figure 1, except that object ID #372 (arc 3.2/4.2) is shown.

Figure 6: Same as Figure 1, except that object ID #955 (arc 3.3/4.3) is shown.

Figure 7: Same as Figure 1, except that object ID #519 (arc 5.1) is shown. The multiple image is heavily contaminated by a foreground cluster member, as can be seen in the two-dimensional HFF postage stamp. However, after subtracting the contamination, the emission lines are clearly detected. This measurement, coupled with the spectroscopic measurements of arcs 5.2, 5.3 and 5.4, represent the first spectroscopic confirmation of this multiple image system, system 5.
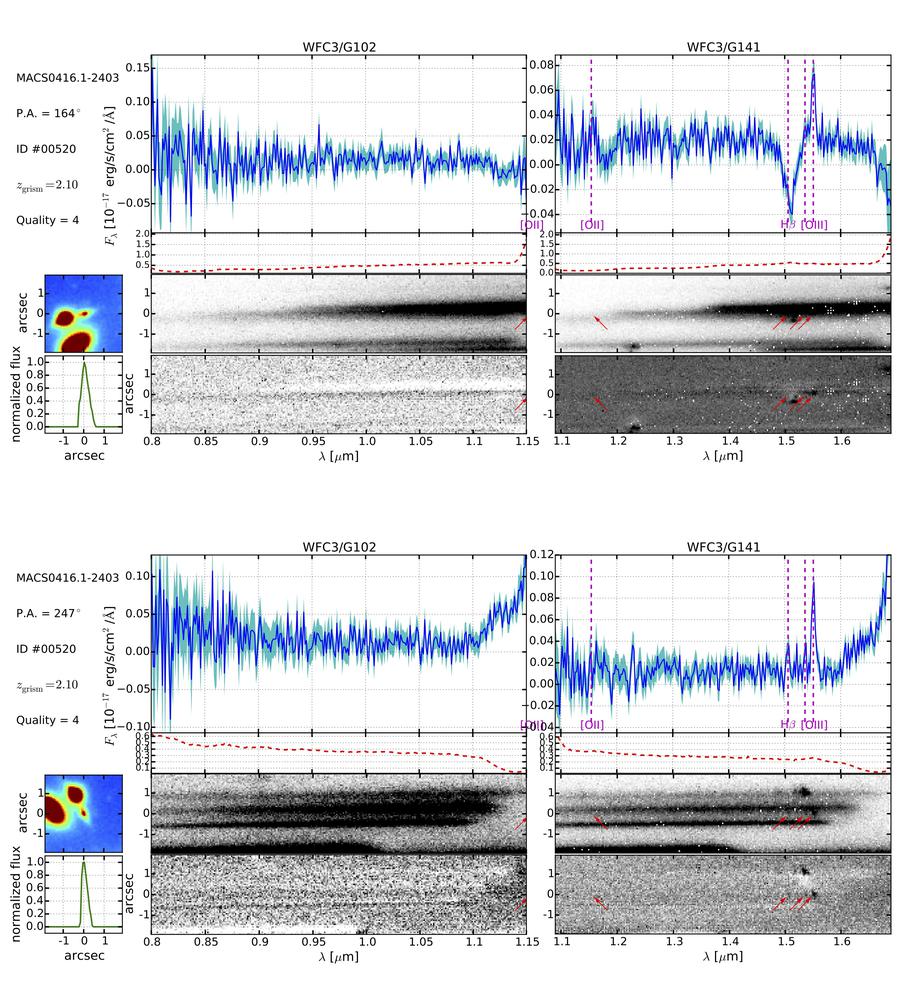
Figure 8: Same as Figure 1, except that object ID #520 (arc 5.2) is shown.

Figure 9: Same as Figure 1, except that object ID #584 (arc 5.3) is shown.
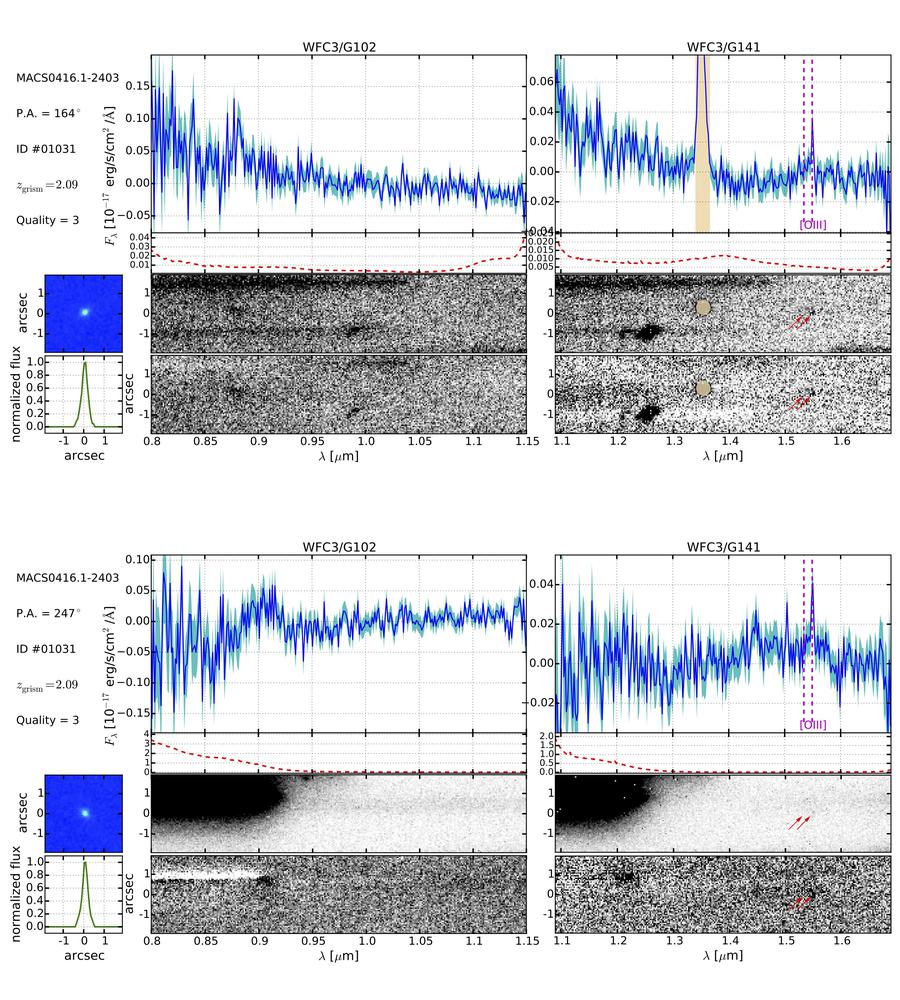
Figure 10: Same as Figure 1, except that object ID #1031 (arc 5.4) is shown. The tan colored region in the one- and two-dimensional P.A.=164◦ G141 spectra covers a contaminant that was not identified by the contamination model. This multiple image received a quality=3 grade due to the identification of only a single line, which we posit is the 5007 line in the [Oiii]λλ4959,5007 doublet. This object was previously believed to be a multiple image in system 5 based on its photometry alone. Because the emission line we detect appears at approximately the same wavelength as the [O iii]λ5007 line in arcs 5.1, 5.2 and 5.3, we confirm the hypothesis that 5.4 is a multiple image of system 5.
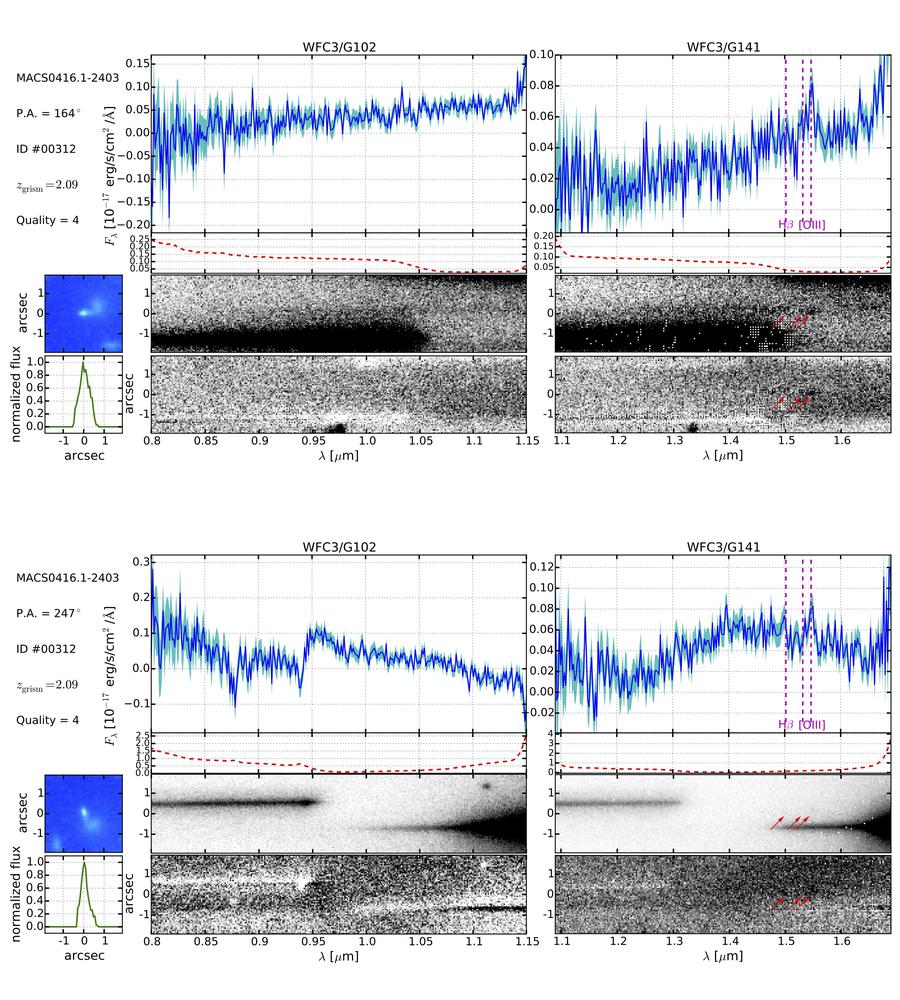
Figure 11: Same as Figure 1, except that object ID #512 (arc 7.1) is shown.

Figure 12: Same as Figure 1, except that object ID #321 (arc 7.2) is shown.

Figure 13: Same as Figure 1, except that object ID #1033 (arc 10.1) is shown.

Figure 14: GLASS spectroscopic confirmation of object ID #456 (arc 12.3). This multiple image is confirmed to z=1.96 +/- 0.02 (68% confidence) by fitting its bright continuum emission in the GLASS spectra to template SEDs using the method described by G. Brammer, (in prep.). Top left – Blue and red lines represent the extracted 1-dimensional flux density from the P.A.=164 degrees and P.A.=247 degrees G102 spectra. Likewise, the green and and cyan lines show the extracted 1-dimensional flux density from the P.A.=164 degrees and P.A.=247 degrees G141 spectra. The solid black (gray) line represents the 1-dimensional extraction of the best-fit 2-dimensional template galaxy grism spectrum for P.A.=164 degrees (P.A.=247 degrees). The black circles and associated error bars represent the photometric measurements from HFF+CLASH imaging. Top right – Probability density functions for the redshift derived from photometry only (green) and from combining photometry and grism data (blue). Combining photometry and grism data results in a more precise constraint on the redshift. Middle row – 2-dimensional postage stamp created from the HFF image on the left, G102 and G141 2-dimensional interlaced grism spectra in the middle and right, respectively, for P.A.=164 degrees. Bottom row – same as middle row, but for P.A.=247 degrees.
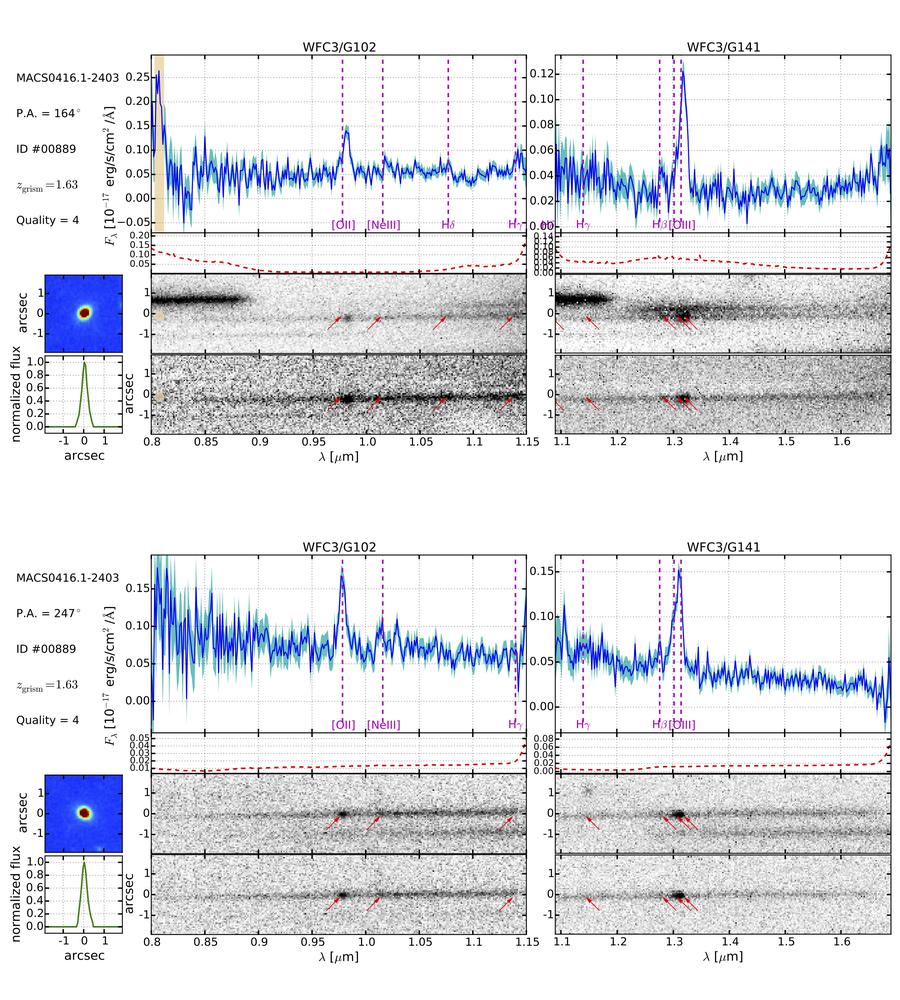
Figure 15: Same as Figure 1, except that object ID #889 (arc 14.1) is shown.

Figure 16: Same as Figure 1, except that object ID #880 (arc 14.2) is shown.

Figure 17: Same as Figure 1, except that object ID #1213 (arc 14.3) is shown.
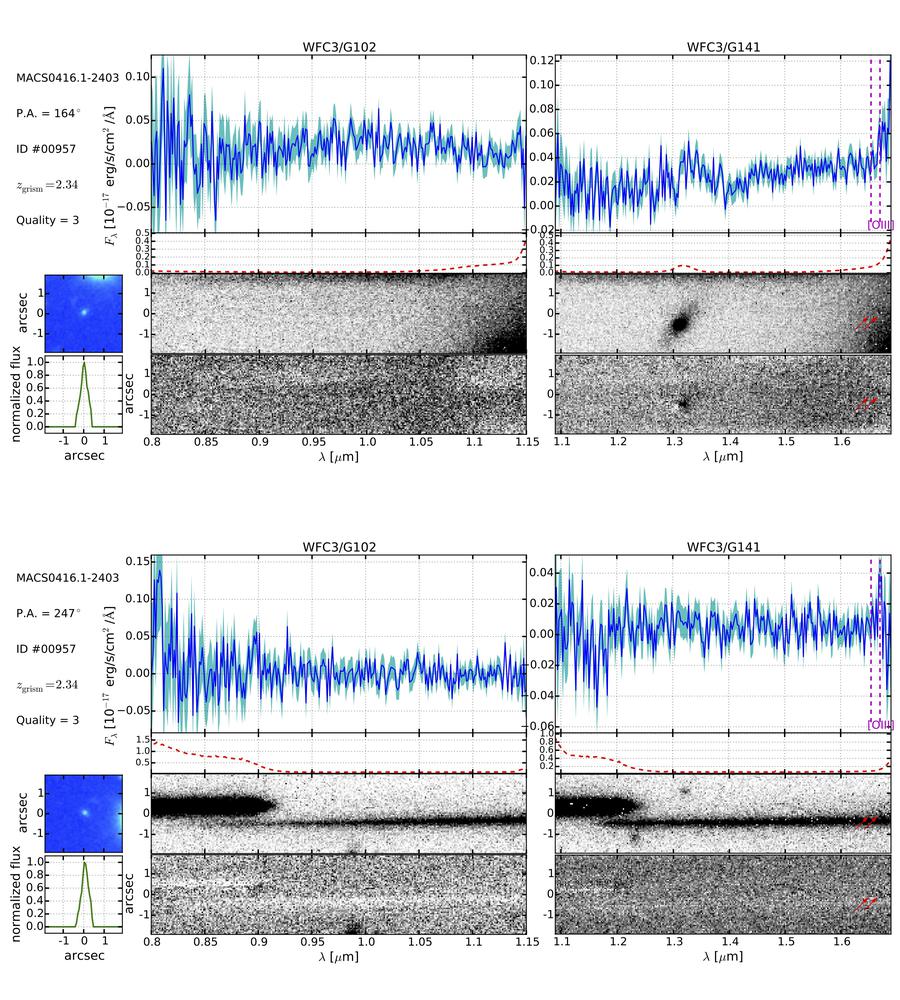
Figure 18: Same as Figure 1, except that object ID #957 (arc 15.1) is shown.
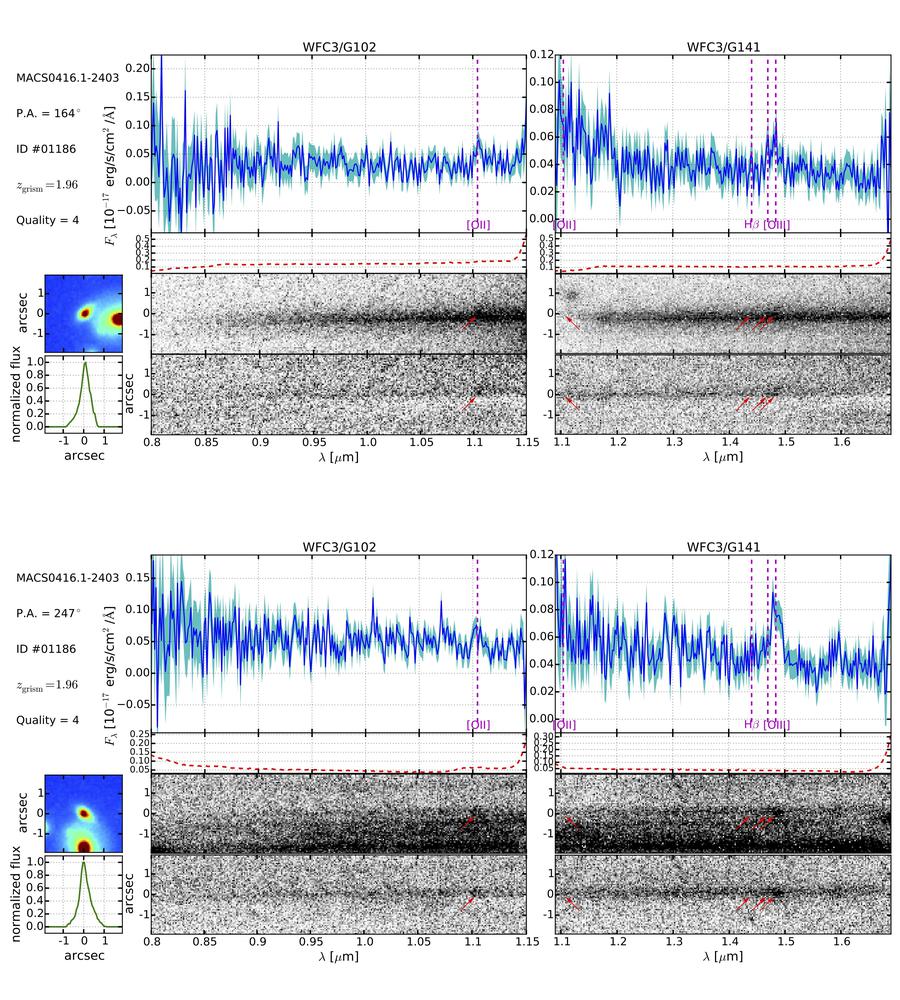
Figure 19: Same as Figure 1, except that object ID #1186 (arc 16.1) is shown.

Figure 20: Same as Figure 1, except that object ID #1362 (arc 16.3) is shown.
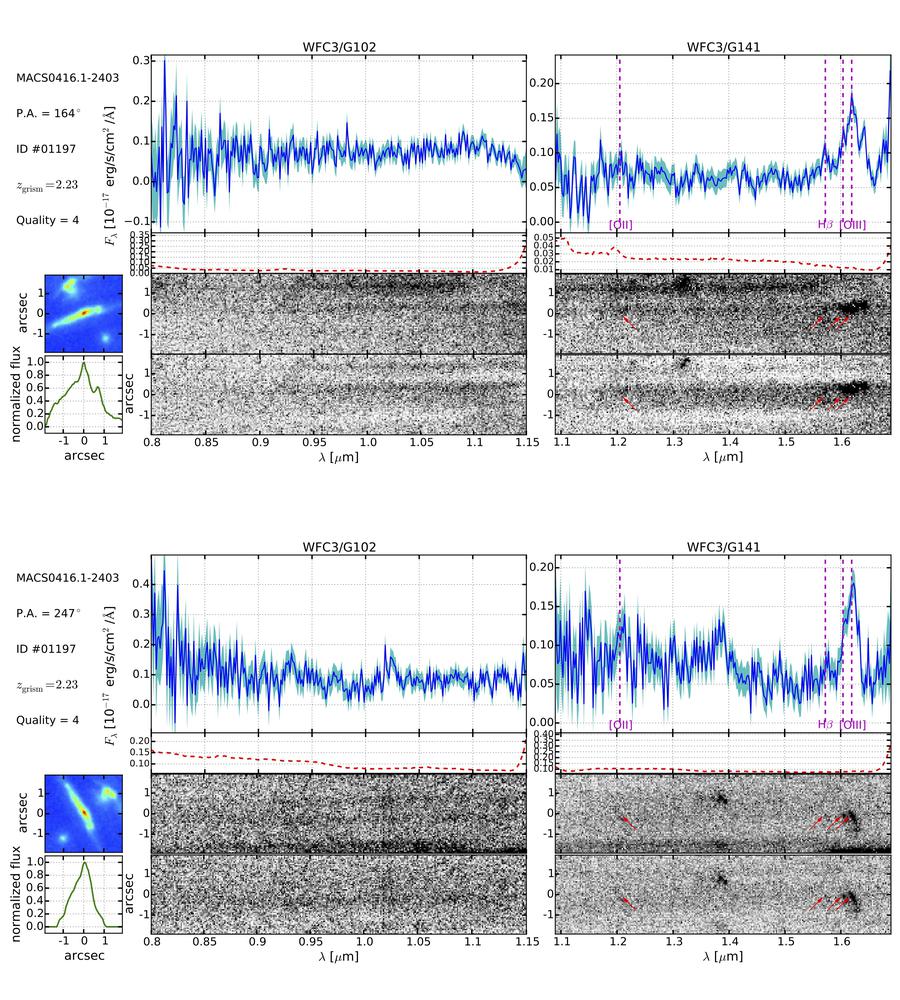
Figure 21: Same as Figure 1, except that object ID #1197 (arc 17.3) is shown.

Figure 22: Same as Figure 1, except that object ID #750 (arc 23.1) is shown.

Figure 23: Same as Figure 1, except that object ID #332 (arc 23.3) is shown.

Figure 25: Same as Figure 14, except that object ID #394 (arc 28.1;28.2) is shown. This multiple image is confirmed to z=0.938 +/- 0.002 (68% confidence) based on bright but extended H-alpha emission that is difficult to see in the 2D spectrum before 1D extraction.

Figure 26: Same as Figure 1, except that object ID #753 (arc 29.3) is shown.